
Disclaimer:
All data was sourced from publicly available datasets. Visuals were done by the EIPS. Datasets retrieved from: NOAA, NASA, IPCC, IEA, Berkeley Earth, 0ur World In Data, IRENA, WEF, World Bank group, Harvard Business School, US Senate Budget Committee, Climate Action Tracker, National Library of Medicine.
I. Global surface temperatures
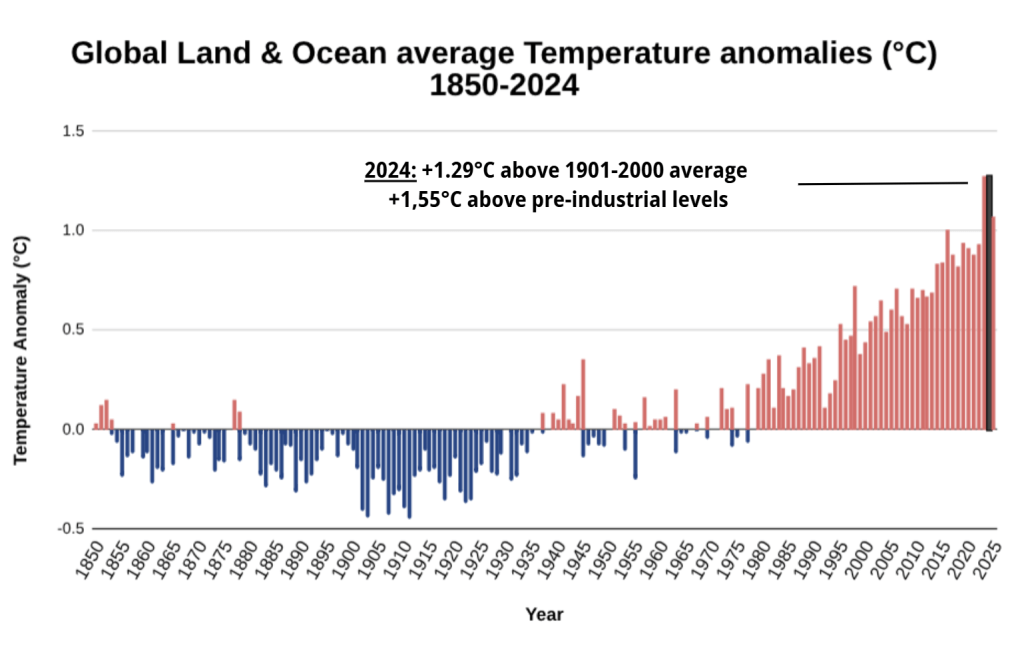
[Chart 1] Source: National Oceanic and Atmospheric Administration (NOAA), Visuals by the EIPS
According to NOAA’s annual report, 2024 was the warmest year on record with a global surface temperature averaging 1.29°C above the 1901-2000 average – or 1.55°C above pre-industrial levels. The short-term observed jump was partially caused by the 2023-2024 El Niño meteorological event, while the upwards trend remains. According to the World Meteorological Organisation, “The past ten years have all been in the Top Ten, in an extraordinary streak of record-breaking temperatures” [1].
Scientists warn that sustained warming between 1°C and 1.5°C places several Earth-system tipping points at high risk. One in particular has lately received scrutiny: global coral bleaching. These systems harbour exceptionally rich biodiversity which supports nearly a third of marine life and a billion people. According to a recent study by the University of Exeter, that tipping point might have been reached, dooming warm-water coral reefs to long-term decline [1] [2].
II. Global temperature pathways
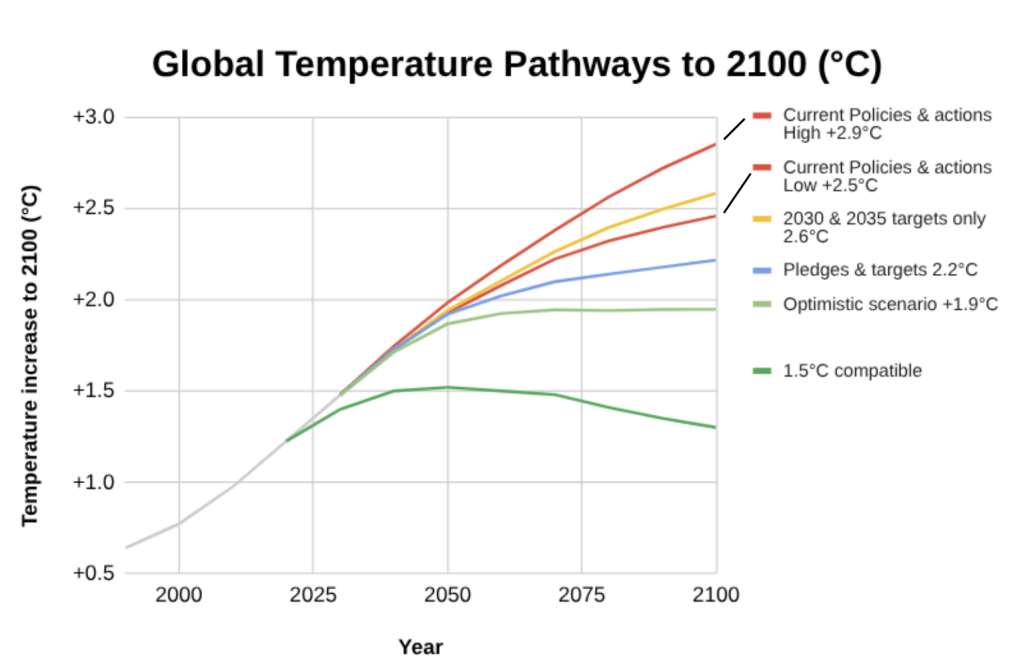
[Chart 2] Source: Climate action tracker, Visuals by the EIPS
According to Climate Action Tracker, “current policy warming of 2.7°C is a median estimate with a 50% chance of being higher or lower.” To reach net zero by 2050, in line with theCOP21 Paris agreement, global emissions have to go down by 43% by 2030 [19].
These temperature increases will have devastating, wide-ranging effects on ecosystems, human health, livelihoods, food security, water supply, and economic growth.
The 2023 IPCC’s sixth assessment report found with high confidence that
“Climate change has caused substantial damages, and increasingly irreversible losses, in terrestrial, freshwater, cryospheric and coastal and open ocean ecosystems. The extent and magnitude of climate change impacts are larger than estimated in previous assessments“ [3].
III. Our earth by 2100: Heat Stress
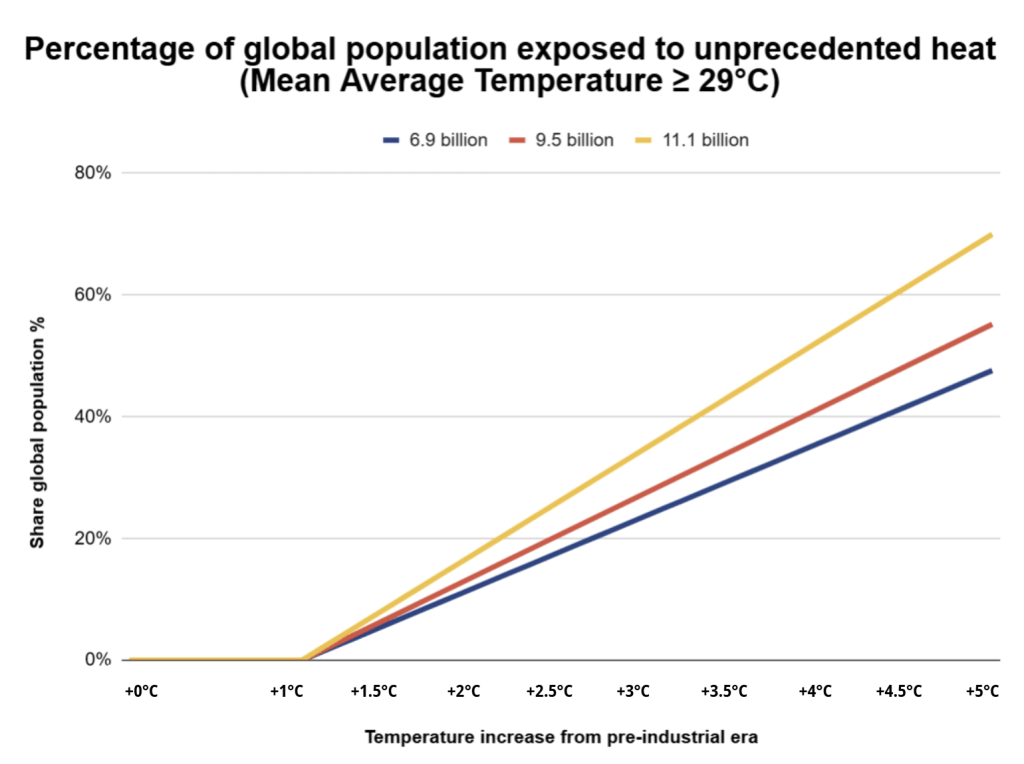
[Chart 3] Source: Nature Climate Change (Lenton, T.M., Xu, C., Abrams, J.F. et al. Quantifying the human cost of global warming. Nat Sustain 6, 1237–1247 (2023). https://doi.org/10.1038/s41893-023-01132-6). Visuals by the EIPS
The chart below showcases the percentage of the world’s population that will live outside the “human climate niche”. For thousands of years, a majority of humanity has lived in areas with a Mean Annual Temperature (MAT) of 13°C. According to the study, “in the absence of migration, one third of the global population is projected to experience a MAT > 29°C by 2100, currently found in only 0.8% of the Earth’s land surface, mostly concentrated in the Sahara. As the potentially most affected regions are among the poorest in the world, where adaptive capacity is low, enhancing human development in those areas should be a priority alongside climate mitigation”. As shown in Chart 2, the projected 2.7°C warming by 2100 under current policies further supports these findings, indicating that hundreds of millions of people may be exposed to extreme heat conditions beyond the historical human niche [4].
IV. Our earth by 2100: Sea level rise
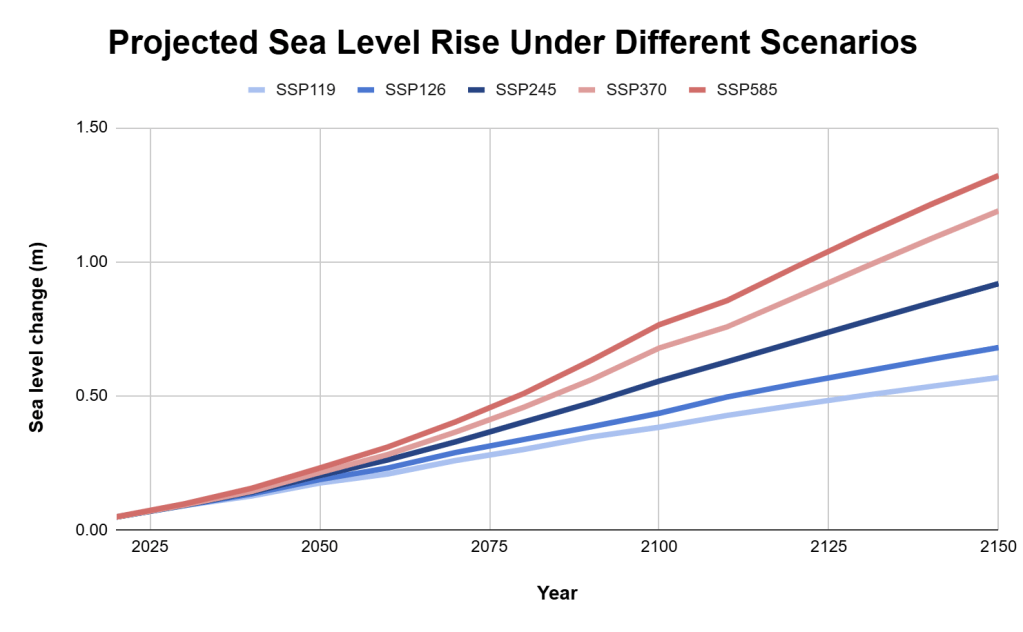
[Chart 4] Source: National Aeronautics and Space Administration (NASA). Visuals by the EIPS
The IPCC’s sixth assessment report (AR6) concluded that with current warming trajectories, about 1 billion people will be exposed to sea-level rise. It also highlights how “extreme sea level events that occurred once per century will then be 20-30 times more frequent”. According to the Copernicus programme, more than 10% of the global population lives in coastal zones less than 10 metres above sea level. The situation is particularly acute in “Small Island Developing States (SIDS) – home to 65 million people. Above 80% of small island residents live near the coast where flooding and coastal erosion already pose serious problems” [20].
The chart above presents projections of sea-level rise across very low (+1,4°C by 2081-2100), low (+1,8°C by 2081-2100), intermediate (+2,7°C by 2081-2100), high (+3,6°C by 2081-2100), and very high emissions scenarios (+4,4°C by 2081-2100) [5].
V. Biodiversity index
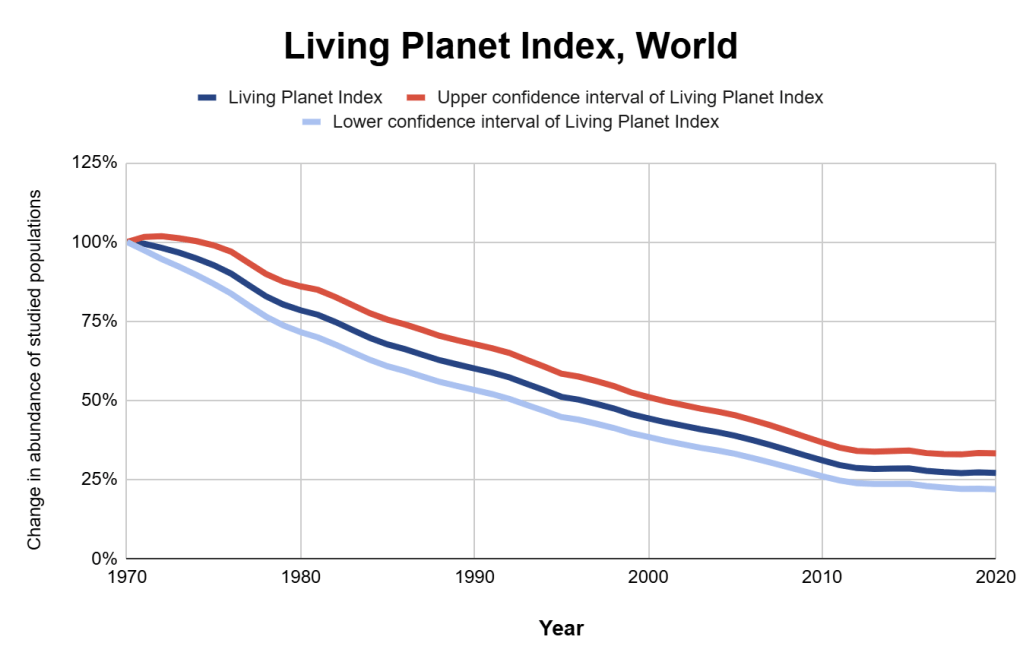
[Chart 5] Source: Our World In Data. Visuals by the EIPS
The Living Planet Index (LPI) measures the relative abundance change in specific monitored wildlife populations. The index value measures the change in abundance in 34,836 populations across 5,495 native species relative to the year 1970 (1970 = 100%). Since 1970, the size of animal populations for which data is available has declined by 73% on average. Due to the scale of species losses driven by pollution, overexploitation, and the destruction of natural habitats, this trend is frequently framed as part of a potential Sixth Mass Extinction – the last comparable event occurring around 66 million years ago at the end of the Cretaceous. What distinguishes this event from previous ones is its speed. On a geological scale, previous events occurred over millions of years, compared to only centuries in the present era [6].
While the index does not capture variation between species – some of which are far more affected than others – it clearly shows a global downward trend [7].
VI. GHG emissions pledges VS implemented policies
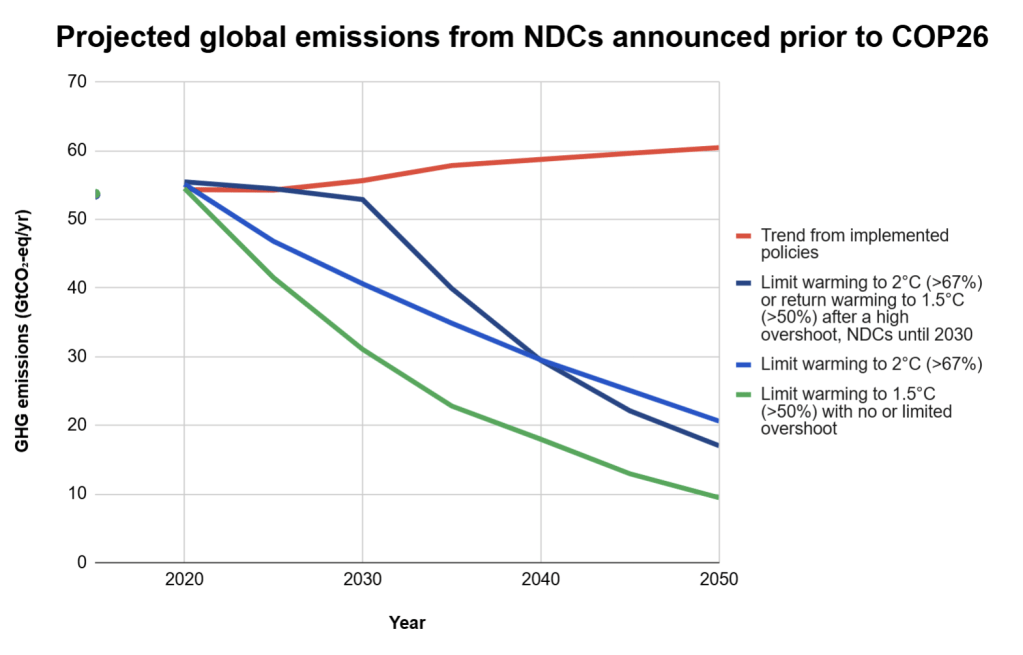
[Chart 6] Source: Intergovernmental Panel On Climate Change (IPCC) AR6. Visuals by the EIPS
Above, the IPCC AR6 projects global emissions from Nationally Determined Contributions (NDCs). These projections indicate that NDCs announced prior to COP26 makes it likely that warming will exceed 1.5°C, significantly hindering the possibility of limiting warming to below 2°C after 2030.
VII. Global energy mix
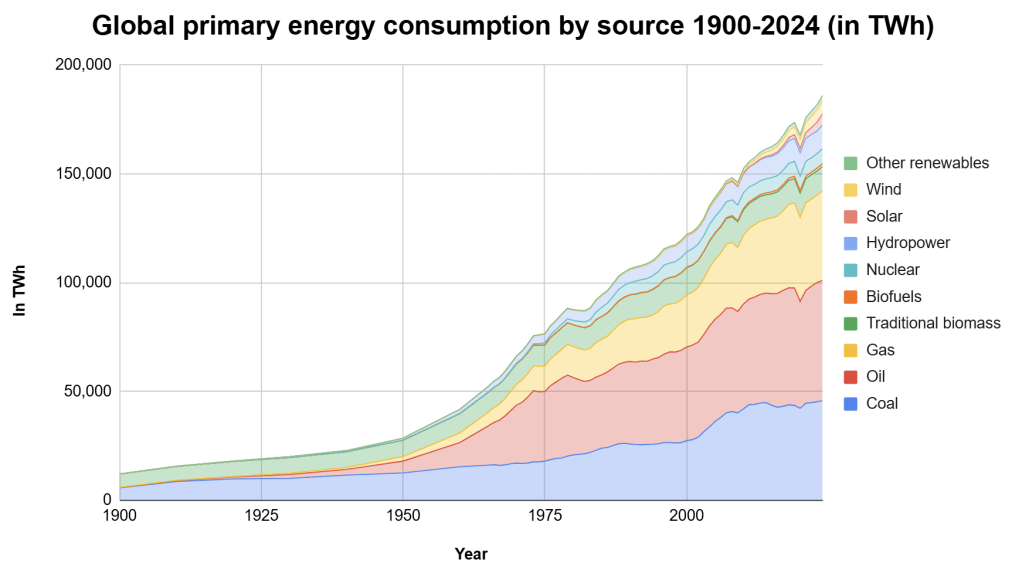
[Chart 7] Source: Our World In Data. Visuals by the EIPS
Energy production – still predominantly derived from burning fossil fuels – accounts for roughly 75% of greenhouse gas emissions. To avert the worst global warming scenarios, the world has to rapidly decarbonise its energy production through renewable energy generation. As shown in the graph above, energy consumption from renewable sources is not yet replacing fossil fuels, but rather meeting growing demand. Additionally, gains in renewable energy have been partially offset by a decrease in nuclear energy production [Chart 7].
One notably positive development is the plateauing of global coal production – the most polluting of all fossil fuels. According to the IEA, “underlying structural drivers of the world’s coal use remain broadly unchanged. As a result, it forecasts a slight increase in global coal demand in 2025, followed by a marginal decline in 2026, bringing demand to just below 2024 levels” [23].
VIII. Oil demand current VS stated policies

[Chart 8] Source: International Energy Agency Oct. 2025 report. Visuals by the EIPS
The long-anticipated ‘peak oil demand’, repeatedly predicted for decades, may still be decades away. A recent report from the International Energy Agency (IEA) estimates oil demand could grow to over 113 million barrels per day (mb/d) by 2050, compared to roughly 104 mb/d today [8].
The graph shows projected oil demand with current policies (red) – regulations & policies that are already in place – compared to stated policies (blue) – regulations & policies that have been adopted and/or that have been formally put forward but not yet adopted, according to the IEA.
EIPS promotion

IX. Global historical VS current emissions
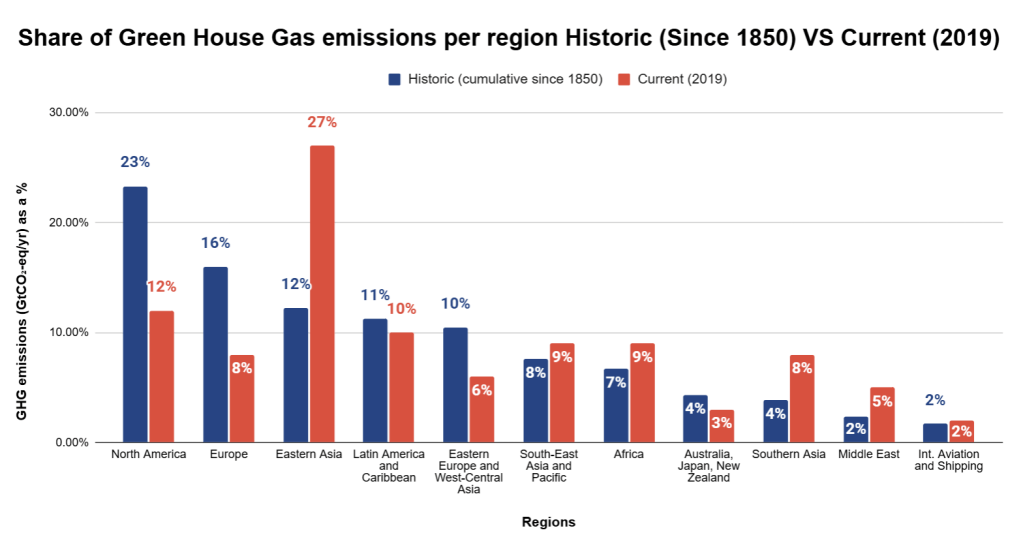
[Chart 9] Source: Intergovernmental Panel On Climate Change (IPCC) AR6. Visuals by the EIPS
During COP negotiations, a strong emphasis is placed on the difference between current and historical (cumulative) emissions. Today, China, the U.S, and India are the largest emitters of greenhouse gases (GHG), but cumulative emissions since pre-industrial levels paint a different picture. Developed nations have contributed disproportionately to global emissions and, by extension, the current climate crisis. Some developing countries therefore argue that wealthier nations should provide around $1.3 trillion annually in climate finance by 2030 to support their transition from high-emission energy systems through both investment and mitigation measures.
X. Renewable investments
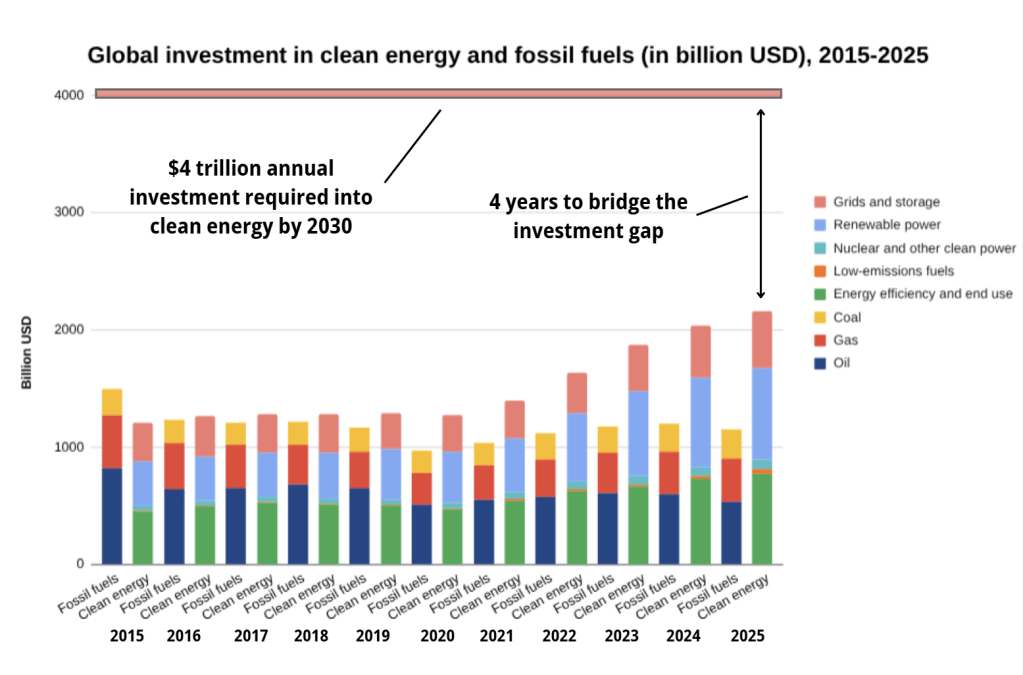
[Chart 10] Source: International Energy Agency Oct. 2025 report. Visuals by the EIPS
Global investment in renewable energy has surpassed that of fossil-fuel in the past decade, reaching approximately $2 trillion in 2025. However, as the International Energy Agency (IEA) notes, “to reach net zero emissions by 2050, annual clean-energy investment worldwide will need to more than triple by 2030, reaching around $4 trillion” – constituting an annual increase of approximately 20% over the next 4 years [9].
XI. Cost of renewables compared to fossil fuel alternatives
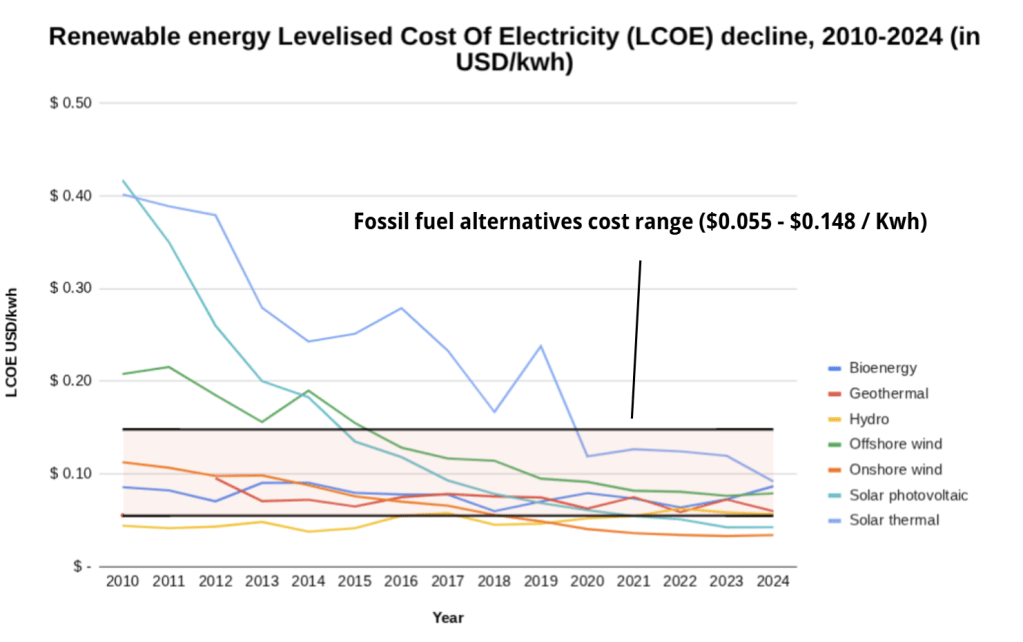
[Chart 11] Source: International Renewable Energy Agency (IRENA). Visuals by the EIPS
This increase in investment as seen in graph 10 has in turn led to a considerable reduction in renewable-energy cost, to the point where, in most instances, not choosing green alternatives is economically unsound. The International Renewable Energy Agency estimates that “91% of New Renewable Projects Now Cheaper Than Fossil Fuels Alternatives“ [21].
XII. Support for climate action

[Chart 11]: Andre, P., Boneva, T., Chopra, F. et al. Globally representative evidence on the actual and perceived support for climate action. Nat. Clim. Chang. 14, 253–259 (2024). https://doi.org/10.1038/s41558-024-01925-3). Visuals by the EIPS
Support for climate action shows a stark discrepancy between personal willingness to contribute and one’s perception of others’ willingness to contribute (WTC). A 2024 study from Nature Climate Change conducted in more than 125 countries and with 130,000 participants revealed “widespread support for climate action […] Notably, 69% of the global population expresses a willingness to contribute 1% of their personal income, 86% endorse pro-climate social norms and 89% demand intensified political action”. Participants in the areas most affected by climate change responded particularly positively to further climate action [10].
XIII. Global EV sales
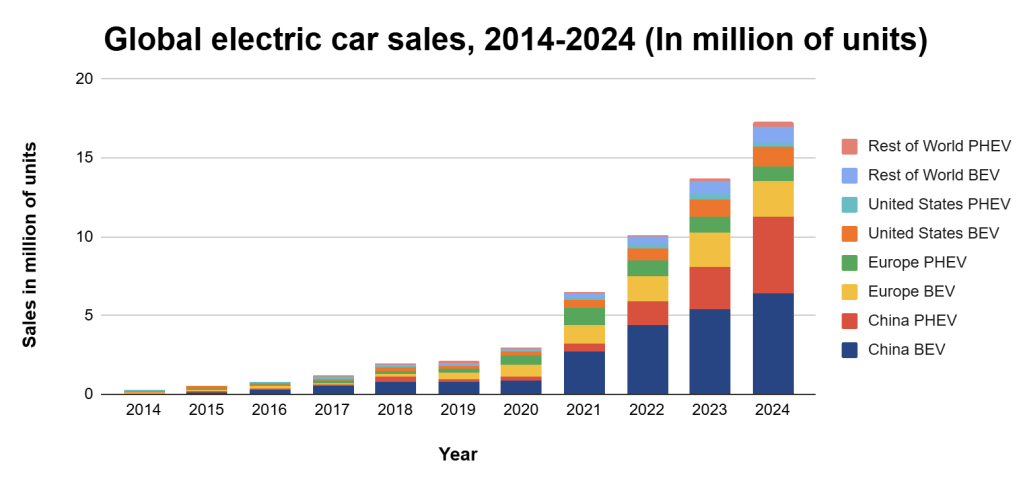

[Chart 12/13] Source: International Energy Agency. Visuals by the EIPS
Similar to renewable energy, improvement in battery storage capabilities has ushered in a new era of electric vehicle (EV) sales. The rapid sales growth witnessed over the past decade supported by state subsidies and investment in charging infrastructure – particularly post-Covid – is slowly plateauing worldwide when China is excluded. Although EVs are emitting and costing considerably less over their lifetime compared to their internal combustion engine alternatives, their upfront price remains much higher, and their value depreciates notably faster. In recent years, concerns for lack of infrastructure, increased electricity prices (in Europe), high price tags, cost of living crisis has poured cold water on the EV industry’s growth projections. Major car producers are now rolling back their EV production to instead shift focus towards their increasingly commercially attractive hybrid vehicle variants [11].
XIV. Commercial flights growth
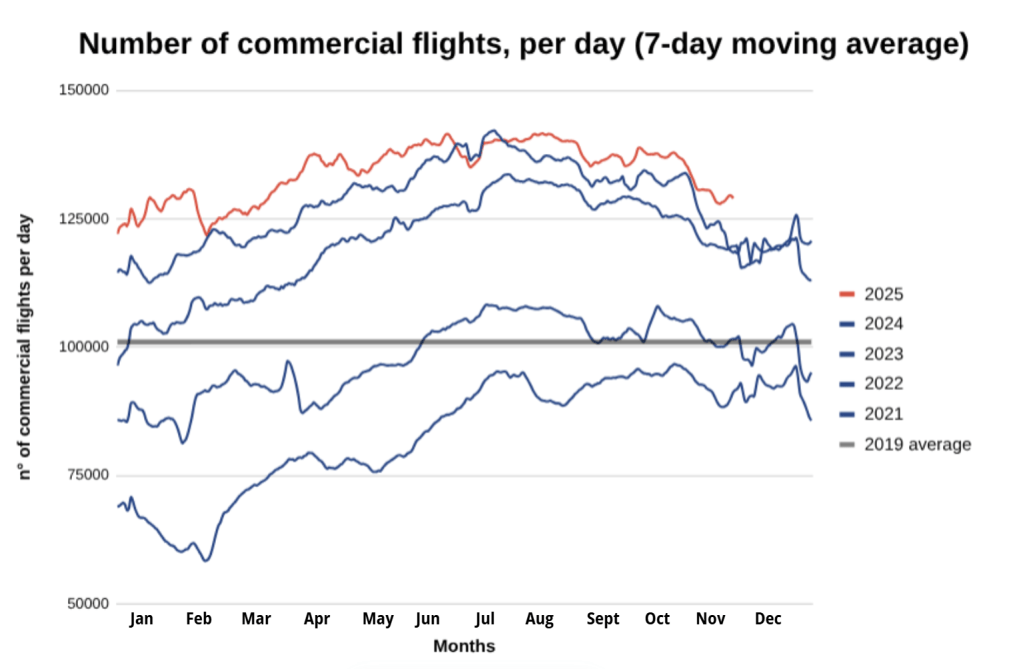
[Chart 14] Source: Flightradar24. Visuals by the EIPS
Following the COVID-19 pandemic in 2020, there were widespread hopes that consumption, travel, and leisure would become more localised rather than international. The highly polarising book The Great Reset, written by World Economic Forum founder Klaus Schwab, captured the mood of the post-Covid world, one grappling with unresolved political, social, and environmental challenges – a publication suspended somewhere between utopia and dystopia [22].
However, 2025 data shows the bleak reality across metrics that international travel has already surpassed pre-pandemic levels. One industry in particular has seen a post-Covid boom: airlines. As shown above, daily commercial flights have risen steadily since the pandemic downturn, surpassing 2019 levels last year and on track to reach even higher volumes this year [12].
Projections of growth in future years has led the airline industry to backpedal on decarbonisation commitments, markedly through investment in sustainable aviation fuel (SAF) and hydrogen-powered planes [13].
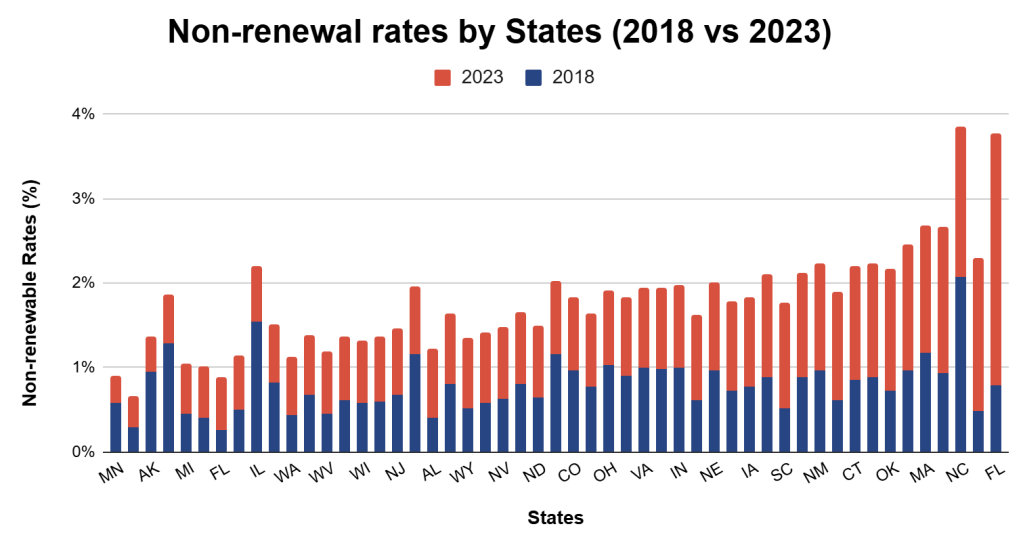
XV. USA case study: Climate change costs on households
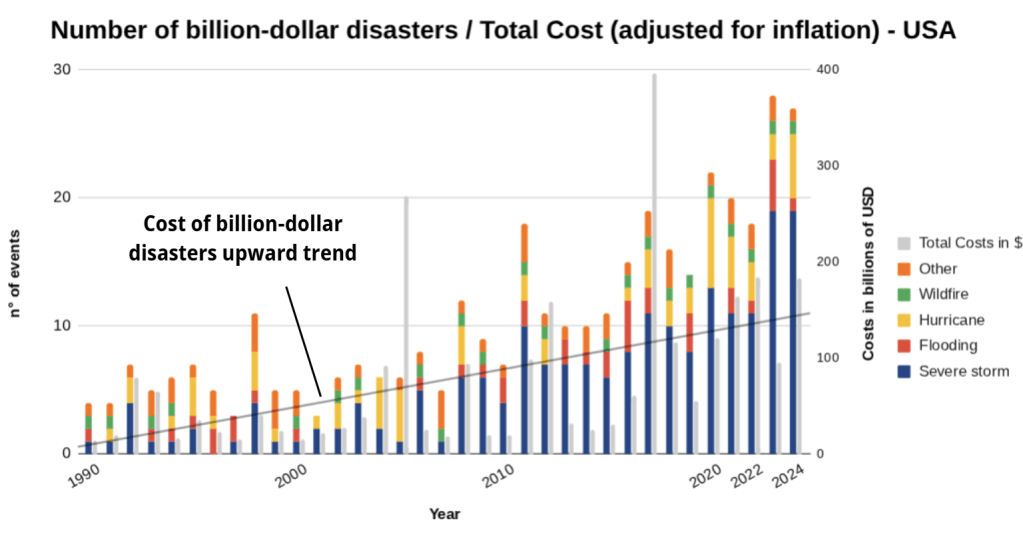
[Chart 15] Source: Source: National Oceanic and Atmospheric Administration (NOAA), Visuals by the EIPS
[Chart 16] Source: US Senate Budget Committee. Visuals by the EIPS

[Chart 17] Source: US Senate Budget Committee. Visuals by the EIPS
The United States frequently makes headlines for extreme weather events – ranging from record droughts and wildfires in the Southwest to increasingly severe floods and hurricanes along the Gulf of Mexico [14].
The country is a great example of how climate change is directly impacting all aspects of society at the federal, state, and county levels. The charts above showcase the increase in extreme weather events over the past 35 years, in addition to each year’s respective costs. On an individual level, a 2024 Senate budget committee report found that a majority of insurers reported a notable increase in both the costs of premiums and their subsequent non-renewal rates – the share of insured individuals who do not renew their contracts. A clear correlation has emerged between rising climate stress on public and private infrastructure, higher insurance premiums, and increased non-renewal rates – leaving many individuals facing difficult decisions about whether they can afford to remain insured [15].
This trend is particularly visible in the most affected counties in Florida (FL), California (CA), Louisiana (LA), and Texas (TX) as seen in Chart 17. The report concludes that “Climate change is no longer just an environmental problem. It is a looming economic threat”.
Insurance premium hikes are only the tip of the iceberg with regard to climate change-related risks – as highlighted in previous charts – but show that it is already having a physical and financial impact on households. If wealthy nations are already victims of climate related stresses, then developing nations are at their mercy. The latest example of category 5 Hurricane Melissa, which made landfall over Jamaica on October 28, exemplifies the differential impact climate change has between nations. The damage from that single tropical storm is expected to amount to half of the country’s GDP (≃$10 billion), with at least 40% of buildings and roads damaged in the western part of the island. Warmer water temperatures, increased humidity, higher sea levels, and the widening gap between surface and stratospheric temperatures, are all contributing to more intense weather events such as Hurricane Melissa, all of which are worsened by global warming [16].
Conclusion
As COP30 wrapped up on November 21 in Belém, Brazil, there was a clear political and scientific consensus that much more ought to be done to mitigate climate change’s worst effects. Despite ongoing trade tensions and geopolitical disputes overshadowing the conference, delegations have nonetheless taken concrete steps to address the issue. But as previously expanded on, mitigation requires a much greater global effort, and with each delay, the environmental and financial costs of inaction are rising, often exponentially.
It is also paramount to recognise that voters worldwide are asking for changes as the crisis deepens and the effect of a quickly warming world is manifested across socio-economic classes. This momentum should be seized by political leaders to advance greater climate action by not overly penalizing lower-income households, but instead equitably sharing the financial burden between developing and wealthy nations. A top-down approach to climate policy may no longer be enough. Real progress requires bottom-up pressure: holding leaders accountable at the ballot box, provided citizens have access to clear, reliable climate science [17] [18].
Edited by Jules Rouvreau.
References
[1]: World Meteorological Organization. (2024). WMO confirms 2024 as warmest year on record: About 1.55°C above pre-industrial level. https://wmo.int/news/media-centre/wmo-confirms-2024-warmest-year-record-about-155degc-above-pre-industrial-level
[2]: Readfearn, G. (2025, April 23). More than 80% of the world’s reefs hit by bleaching after worst global event on record. The Guardian. https://www.theguardian.com/environment/2025/apr/23/coral-reef-bleaching-worst-global-event-on-record
[3]: Climate Action Tracker. (2024). Global update: COP29—Closing the 1.5°C gap. https://climateactiontracker.org/documents/1277/CAT_2024-11-14_GlobalUpdate_COP29.pdf
[4]: Lovejoy, T. E., & Hannah, L. (2020). Biodiversity and climate change: Transforming the biosphere. Proceedings of the National Academy of Sciences, 117(16), 8675–8683. https://pmc.ncbi.nlm.nih.gov/articles/PMC7260949/
[5]: Athanasiou, P., van Dongeren, A., Pronk, M., Giardino, A., Vousdoukas, M., & Ranasinghe, R. (2024). Global Coastal Characteristics (GCC): A global dataset of geophysical, hydrodynamic, and socioeconomic coastal indicators. Earth System Science Data, 16, 3433–3452. https://essd.copernicus.org/articles/16/3433/2024/
[6]: World Wildlife Fund. (2024). What is the Sixth Mass Extinction—and what can we do about it? https://www.worldwildlife.org/resources/explainers/what-is-the-sixth-mass-extinction-and-what-can-we-do-about-it/
[7]: Ritchie, H. (2023). Mass extinctions. Our World in Data. https://ourworldindata.org/mass-extinctions
[8]: Sheppard, D. (2025, November 13). Oil oversupply leaves the world awash in barrels, says IEA. Financial Times. https://www.theguardian.com/business/2025/nov/13/oversupply-oil-barrels-energy-watchdog-iea
[9]: International Energy Agency. (2021). Net zero by 2050: A roadmap for the global energy sector. https://www.iea.org/reports/net-zero-by-2050
[10]: Andre, P., Boneva, T., Chopra, F., et al. (2024). Globally representative evidence on the actual and perceived support for climate action. Nature Climate Change, 14, 253–259. https://doi.org/10.1038/s41558-024-01925-3
[11]: International Energy Agency. (2025). Global EV outlook 2025: Trends in electric car markets. https://www.iea.org/reports/global-ev-outlook-2025/trends-in-electric-car-markets-2
[12]: Statista. (2024). Global air passenger traffic. https://www.statista.com/chart/24107/global-air-passenger-traffic/
[13]: Financial Times. (2025). How politicians and passengers gave up on greener air travel. Kenza Bryan, Peter Campbell and Attracta Mooney. Oct 2025. Retrieved from: https://www.ft.com/content/4e8d050f-f84c-4361-92e1-99f113c6d7f0
[14]: National Centers for Environmental Information. (2024). Billion-dollar weather and climate disasters. https://www.ncei.noaa.gov/access/billions/
[15]: U.S. Senate Budget Committee. (2024). Next to fall: The climate-driven insurance crisis is here—and getting worse. https://www.budget.senate.gov/imo/media/doc/next_to_fall_the_climate-driven_insurance_crisis_is_here__and_getting_worse.pdf
[16]: U.S. Department of State. (2024). Responding to Hurricane Melissa. https://www.state.gov/responding-to-hurricane-melissa
[17]: Financial Times. (2025). [Article; full citation unavailable without title]. https://www.ft.com/content/e0d617b5-1728-4d7d-b8ff-ef5b79f9bbdc
[18]: Lemaître, P. (2025, November 23). Avec un accord sans ambition, la COP30 sauve le multilatéralisme mais néglige l’urgence climatique. Le Monde. https://www.lemonde.fr/planete/article/2025/11/23/avec-un-accord-sans-ambition-la-cop30-sauve-le-multilateralisme-mais-neglige-l-urgence-climatique_6654493_3244.html
[19]: United Nations Framework Convention on Climate Change. (n.d.). L’Accord de Paris. https://unfccc.int/fr/a-propos-des-ndcs/l-accord-de-paris
[20]: United Nations Development Programme. (2024, April 30). Small Island Developing States are on the frontlines of climate change – here’s why. UNDP Climate Promise. https://climatepromise.undp.org/news-and-stories/small-island-developing-states-are-frontlines-climate-change-heres-why
[21]: International Renewable Energy Agency. (2025, July 22). 91% of new renewable projects now cheaper than fossil fuels alternatives. IRENA. https://www.irena.org/News/pressreleases/2025/Jul/91-Percent-of-New-Renewable-Projects-Now-Cheaper-Than-Fossil-Fuels-Alternatives
[22]: Audureau, W. (2021, February 10). Qu’est-ce que « The Great Reset », un livre devenu théorie du complot ? Le Monde. https://www.lemonde.fr/les-decodeurs/article/2021/02/10/qu-est-ce-que-the-great-reset-un-livre-devenu-theorie-du-complot_6069491_4355770.html
[23]: International Energy Agency. (2025, July 24). Global coal demand to remain on a plateau in 2025 and 2026 [Press release]. https://www.iea.org/news/global-coal-demand-to-remain-on-a-plateau-in-2025-and-2026
[Cover image] “Tours électriques pendant l’heure d’or”, n.d. (https://www.pexels.com/fr-fr/photo/tours-electriques-pendant-l-heure-d-or-221012/), EIPS montage. Picture by Pixabay (https://www.pexels.com/fr-fr/@pixabay/) licensed under Pexels.
[Chart 1]: National Centers for Environmental Information. (2024). Climate at a glance: Global time series. NOAA. https://www.ncei.noaa.gov/access/monitoring/climate-at-a-glance/global/time-series
[Chart 2]: Climate Action Tracker. (2024). The climate crisis worsens: The warming outlook stagnates. https://climateactiontracker.org/publications/the-climate-crisis-worsens-the-warming-outlook-stagnates/
[Chart 3]: Lenton, T. M., Xu, C., Abrams, J. F., et al. (2023). Quantifying the human cost of global warming. Nature Sustainability, 6, 1237–1247. https://doi.org/10.1038/s41893-023-01132-6
[Chart 4]: NASA Jet Propulsion Laboratory. (2023). IPCC AR6 sea-level projection tool. NASA Sea Level Change Portal. https://sealevel.nasa.gov/ipcc-ar6-sea-level-projection-tool?type=global
[Chart 5]: Ritchie, H., & Roser, M. (2024). Biodiversity. Our World in Data. https://ourworldindata.org/biodiversity
[Chart 6]: Intergovernmental Panel on Climate Change. (2021–2023). Sixth Assessment Report (AR6). https://www.ipcc.ch/assessment-report/ar6/
[Chart 7]: Ritchie, H., & Roser, M. (2024). Energy mix. Our World in Data. https://ourworldindata.org/energy-mix
[Chart 8]: International Energy Agency. (2025). World Energy Outlook 2025. https://iea.blob.core.windows.net/assets/5306bae2-1f99-402f-8d14-542bfa0ae96e/WorldEnergyOutlook2025.pdf
[Chart 9]: Intergovernmental Panel on Climate Change. (2021–2023). Sixth Assessment Report (AR6). https://www.ipcc.ch/assessment-report/ar6/
[Chart 10]: International Energy Agency. (2025). Global investment in clean energy and fossil fuels: 2015–2025. https://www.iea.org/data-and-statistics/charts/global-investment-in-clean-energy-and-fossil-fuels-2015-2025
[Chart 11]: Andre, P., Boneva, T., Chopra, F., et al. (2024). Globally representative evidence on the actual and perceived support for climate action. Nature Climate Change, 14, 253–259. https://doi.org/10.1038/s41558-024-01925-3 (Visualisation adapted by the EIPS.)
[Chart 12/13]: International Energy Agency. (2025). Global EV outlook 2025: Trends in electric car markets. https://www.iea.org/reports/global-ev-outlook-2025/trends-in-electric-car-markets-2
[Chart 14]: Flightradar24. (2024). Live air traffic data and statistics. https://www.flightradar24.com/
[Chart 15]: National Centers for Environmental Information. (2024). Billion-dollar weather and climate disasters. NOAA. https://www.ncei.noaa.gov/access/billions/
[Chart 16/17]: U.S. Senate Budget Committee. (2024). Next to fall: The climate-driven insurance crisis is here — and getting worse. https://www.budget.senate.gov/imo/media/doc/next_to_fall_the_climate-driven_insurance_crisis_is_here__and_getting_worse.pdf


Leave a comment